Presidents and Markets: Investing Observations Based on Who Is in Charge
Key Takeaways:
- Don’t Base Investment Decisions on Election Outcomes — While political debates often stir strong opinions, historical data shows little correlation between which party is in power and market performance. Markets are influenced more by global economic forces and central bank policy than by election results.
- The Federal Reserve Has More Market Influence Than Elected Officials — Interest rate decisions and monetary policy from the Fed tend to drive market movements far more than legislative changes. Economic shocks, not political transitions, affect the market.
- Invest Based On Your Goals — Trying to predict market moves based on who wins an election is a distraction. A long-term, goal-based investment strategy is more effective than reacting to political cycles or media narratives.
Usually during election years, I hear people talk about how the markets will move one way or another when gets elected. It’s a debate that tends to anchor itself in each person’s own political views and biases and doesn’t have any practical takeaways. I usually tell people who ask me “Will the market do better with President X or President Y in charge?” that it really doesn’t matter as much as you think it does. Markets are so globally connected now, and unless there are some drastic tax law changes or market structure reforms, markets will be influenced by the numerous macro and micro variables that have affected them regardless of President (or Congress). I’d argue that our Federal Reserve has more influence on global stock markets than any elected official. For instance, let’s look at the last 10 bear markets and their causes (courtesy of JP Morgan) – try to find anything strongly relating to legislative actions:
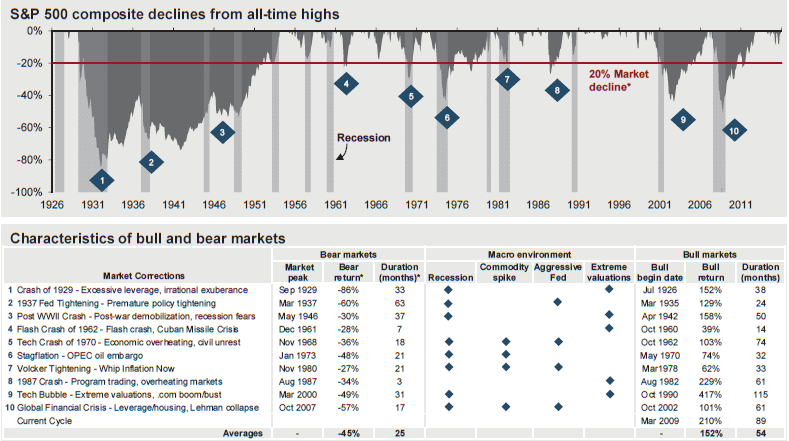
Source: FactSet, NBER, Robert Shiller, Standard & Poors, J.P. Morgan Asset Management. *A bear market is defined as a 20% or more decline from the previous market high. The bear return is the peak to trough return over the cycle. Periods of “Recession” are defined as using NBER business cycle dates. “Commodity spikes” are defined as significant rapid upward moves in oil prices. Periods of “Extreme valuations” are those where S&P 500 last 12 months’ P/E levels were approximately two standard deviations above long-run averages. “Aggressive Fed Tightening” is defined as Federal Reserve monetary tightening that was unexpected and/or significant in magnitude. Guide to the Markets – U.S. Data are as of June 30, 2016.
Disclaimer: All this will change should President Trump take office. My guess is that bear markets will be banned via executive order.
The following chart from Goldman Sachs shows returns of the S&P 500 Index by which political party is holding the Presidency and majority in Congress. The chart on the right determines the strength of relationship between election results and market performance. As you can see, the relationship is weak.
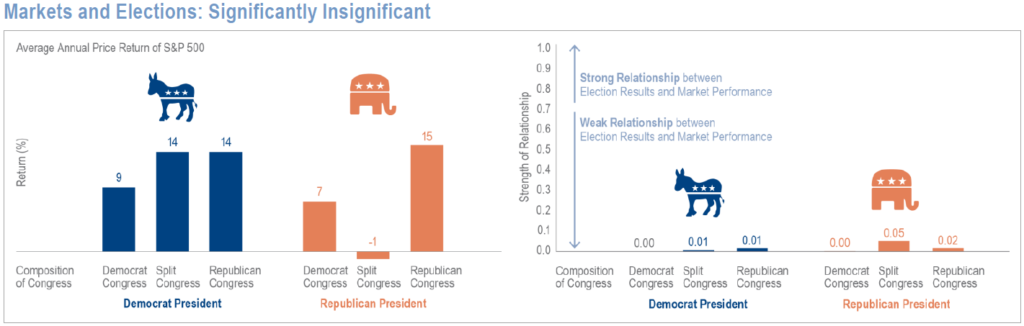
Left chart: Analysis from 12/31/1946 to 12/31/2015. The S&P 500 returns show average annual price returns for each Presidential party and corresponding Congressional party majority. Composition of Congress – Republican Congress refers to when both the House of Representatives and Senate have a Republican majority in both chambers; Democrat Congress refers to when both the House of Representatives and Senate have a Democrat majority in both chambers; Split Congress is when House of Representatives and Senate are not controlled by the same party. The S&P 500 returns show average annualized price returns for each major Presidential party and corresponding Congressional party majority. Right Chart: Analysis from 12/31/1946 to 12/31/2015. Strength of relationship is determined by R-Squared, a statistical measurement of how close a set of data fits a regression model (best-fitting line). Diversification does not protect an investor from market risk and does not ensure a profit. Past performance does not guarantee future results, which may vary.
So, what’s the lesson? Invest based on your own personal and financial goals and not on who’s in charge.
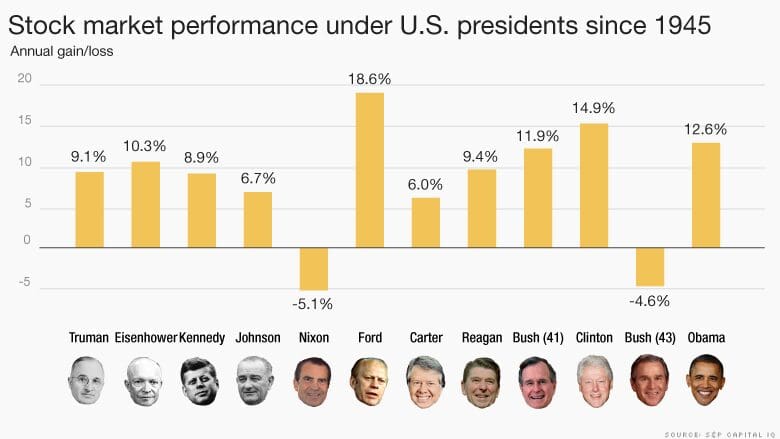
Bonus material: The following graphic from CNN Money shows the average annual gain for the S&P 500 Index during each presidency, as calculated by S&P Capital IQ: